

Market Analytics
March 12, 2022

Property Records
January 8, 2022

Methodology
November 3, 2022



Every deed, mortgage, and permit is filed with a county. You can search those records here for who owns a building, what it sold for, and what your submarket actually trades at.






If you work a farm area, buy regional assets, write comps, or sell to owners, you can pull ownership and transaction data here without enterprise platform pricing.

If you broker a farm area of a few hundred buildings, pull owner and sale history without paying enterprise rates.

If you buy in a region, use recorded sales and debt maturity windows to find owners who may sell.

If you write comps, use recorded transactions with sample size and as-of date on every figure.

If you sell to owners, use business-entity contact data from public filings, with a clear opt-out path.
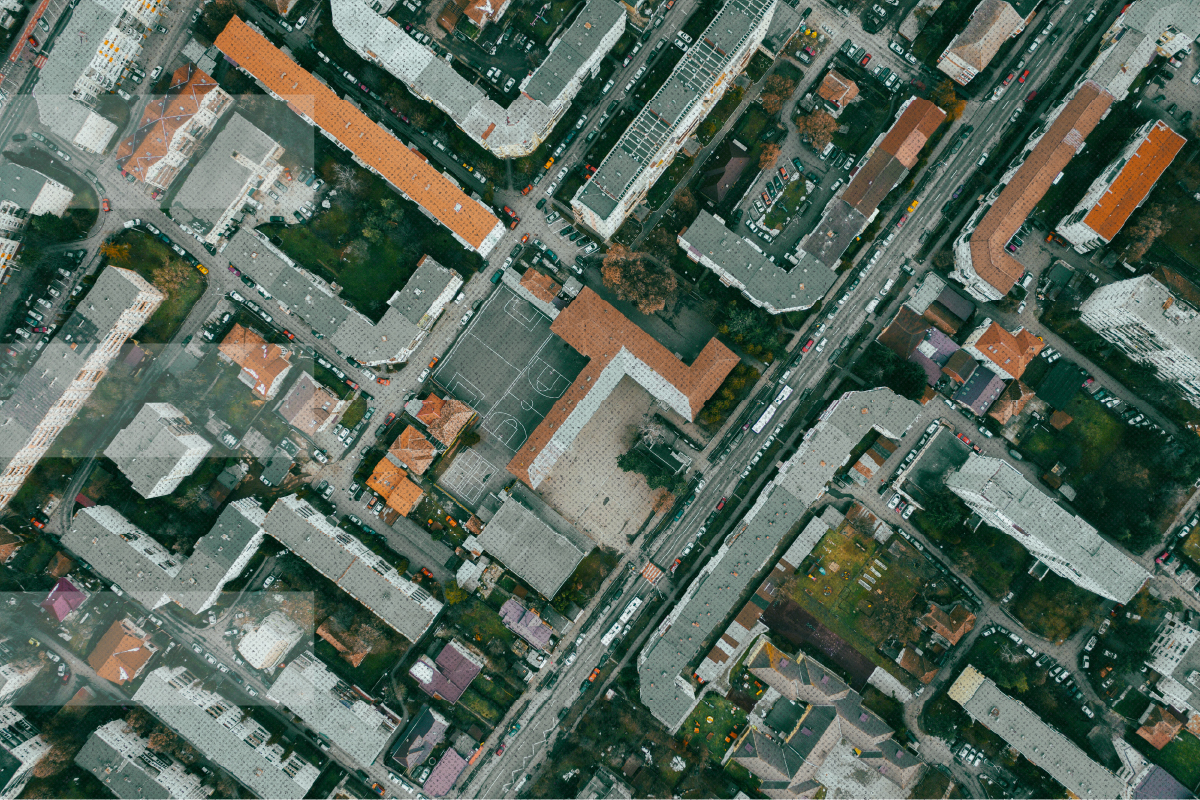

Property search is paid. Market analytics are free. Both are built from the same county filings.
Owner of record, sale price and date, mortgage and maturity, and permit history. Filter by metro, asset class, owner, sale date, or maturity window.
Submarket averages and medians for $/SF, sale volume, transaction count, hold periods, ownership concentration, and permit activity. Open with no account.
You will not find availability, listings, cap rates, rents, vacancy, or absorption here. Those are not in the filings we sell.

Search a parcel for owner of record, last sale price and date, mortgage maturity, and permit history. Filter by metro, asset class, and filing window.

Open free market analytics for your submarket: median $/SF, sale volume, transaction count, hold periods, and ownership concentration. No account required.

Every published figure shows its sample size and as-of date. If the sample is too thin to support a number, we do not publish it.

"I checked my own submarket first. The median $/SF and sample size matched what I had pieced together from county sites, so I trusted the rest of the records."

"Owner of record and maturity windows used to take a morning of phone calls. Now I filter a farm area and save the search."

"For comps I need recorded sales with dates and sample size. Cap rates and rents are not here, which is the point. The filings are."

"We sell to owners. Business-entity contact from public filings, with a clear opt-out, is what we needed. Not a lending pitch."

"Enterprise platforms priced us out. Esser covers the secondary metros we actually work, and the free analytics made coverage easy to verify."

"Every figure shows as-of date and sample size. When the sample is thin, they say so. That restraint is why we subscribe."




Market analytics are free with no account required: submarket averages, volumes, and trends. Property-level records, saved searches, alerts, and export require a paid subscription.
No. Esser Capital does not represent buyers, sellers, landlords, or tenants, does not negotiate or facilitate transactions, and does not take commissions. You get information compiled from county filings.
Ownership, transactions, and analysis built on filings: price per square foot, sale volumes, trends, hold periods, and permit activity. We do not publish cap rates, rents, vacancy, or absorption.
$49 per month for one metro, $149 for regional multi-metro access, and $399 for multi-region with bulk export and API. Annual billing is discounted. Pricing is public.
Yes. Every statistic shows its sample size and as-of date. Thin samples are suppressed rather than published. If the sample is too small, we say so.
No. Analysis is decision support, not advice. We do not provide valuations of specific properties, buy sell or hold recommendations, or investment guidance.